Traders often rely on multiple indicators to determine optimal entry and exit points and to forecast asset price movements. Among these, Fibonacci circles remain one of the most versatile tools. They help identify potential support and resistance levels as well as zones of price consolidation. Despite their seemingly simple appearance, effective use requires a deep understanding of market dynamics and the ability to combine various technical analysis techniques.
Here’s a detailed guide on how Fibonacci circles work, how they differ from other tools, and how to integrate them into a trading strategy.
Understanding Fibonacci Circles and Their Purpose
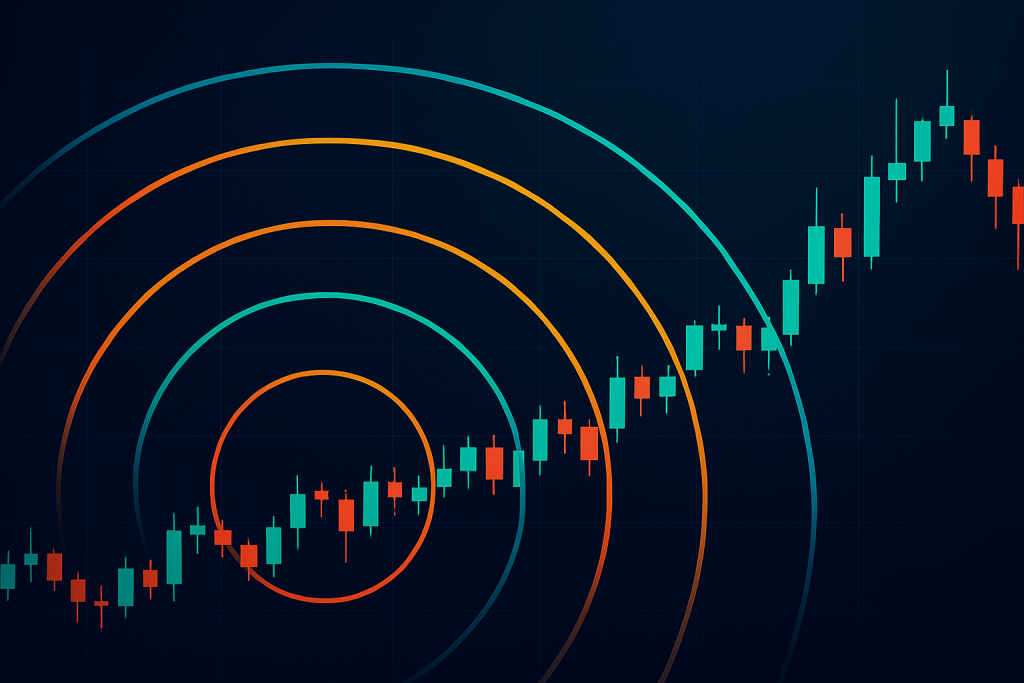
Fibonacci circles are a graphical technical analysis tool displayed as a series of arcs based on Fibonacci ratios. On trading platforms, they may be labeled as Fibonacci Arcs or Fibonacci Circles.
To construct these arcs, traders connect two key points—the swing low and swing high—to define the range. The arcs’ radii correspond to Fibonacci sequence ratios, forming concentric curves on the chart that indicate potential areas of support or resistance.
The key advantage of Fibonacci circles over horizontal Fibonacci levels is that they incorporate time as well as price, illustrating how key price points shift as a trend develops. Main functions include:
- Visualizing consolidation zones and potential reversal points.
- Forecasting trend breakouts or retracements.
- Identifying dynamic support and resistance levels.
- Improving analysis accuracy when combined with volume data.
This makes Fibonacci circles particularly useful during sideways markets. After rapid rallies in Bitcoin or altcoins, prices often enter consolidation phases, oscillating between the 38.2% and 61.8% arcs. Circles help traders anticipate not only the current range but also potential breakout points.
Setting Up Fibonacci Circles for Low-Liquidity Assets
Many altcoins have low market capitalization and liquidity, making them prone to sharp price swings. In such conditions, standard support and resistance levels may fail, but Fibonacci circles can reveal emerging patterns and stabilization zones.
- Define the range between swing low (0%) and swing high (100%).
- Uptrend setup: draw from low to high. Downtrend setup: draw from high to low.
For example, if an altcoin rises from $0.10 to $0.15 over a week, $0.10 is the swing low, and $0.15 is the swing high. This range sets the basis for the arcs.
Platforms like TradingView, Binance, and Bybit offer Fibonacci circles under graphical analysis tools. Once selected, click on the swing low and extend to the swing high; the software automatically generates arcs for analysis.
Standard Fibonacci ratios include: 23.6%, 38.2%, 50%, 61.8%, 78.6%, and extensions like 161.8% and 261.8%. For low-liquidity assets, 3–4 arcs are usually sufficient to avoid chart clutter. Optimal timeframes are H4 or D1, where consolidations typically last 5–10 days.
Trading Strategies with Fibonacci Circles
Fibonacci circles excel during sideways market phases when the market accumulates momentum for the next trend. Combining circles with Volume Profile, RSI, or MACD improves precision.
1. Arc Bounce Strategy
- Price oscillates between arcs during consolidation.
- For long entries: approach lower arc (e.g., 38.2%) while RSI > 50.
- Stop-loss just below the arc; take-profit at the next arc.
- Same logic applies inversely for short trades near upper arcs (e.g., 61.8%).
2. Breakout Strategy
- Extended consolidation increases order pressure.
- Break above upper arc signals bullish trend; validate with rising volume.
- Target extended Fibonacci levels, like 161.8%, for potential exit.
- Filtering with Fibonacci time zones reduces false signals.
While Fibonacci circles don’t generate automatic trade signals, they enhance decision-making when combined with volume, temporal analysis, and basic momentum indicators. Avoid overcrowding charts with too many arcs, and do not rely on them during strong trending markets. They are most effective during accumulation phases prior to a trend shift.
Practical Example: Arc Bounce Trade
- Exchange: Binance (spot market)
- Entry Date: May 6, 2025
- Entry Price: $93,709
- Exit Date: May 8, 2025
- Exit/Take-Profit: $103,000 (+9.9%)
- Stop-Loss: $91,000 (-2.8%)
- Risk/Reward Ratio: 3.53
In this case, Bitcoin’s price retraced after a rally and touched the 38.2% arc, which acted as support. Additional confirmations included:
- RSI at 37, signaling oversold conditions.
- Low trading volume, indicating weakening selling pressure.
The combination provided a reliable long entry, with profit realized at the next arc. Maintaining a trader’s journal is essential, documenting:
- Entry/exit timestamps
- Prices and rationale
- Indicators used
- Risk/reward ratios
- Observations and emotions
This helps identify patterns and refine strategies over time.
Fibonacci circles provide a dynamic perspective on market structure, highlighting both price and time ranges. They help traders identify consolidation zones, anticipate breakouts, and locate high-probability entry points.
On crypto markets, these arcs are particularly valuable during uncertain conditions, showing where price may pause, accumulate volume, and change direction. When combined with RSI, volume analysis, and risk management, Fibonacci circles become an effective component of a trader’s toolkit.


