


Bitcoin Price Analysis
On October 6, 2025, Bitcoin reached a new all-time high above $126,000, before retracing slightly. Cryptology Key analysts reviewed multiple timeframes to provide insights into potential corrective and continuation zones.
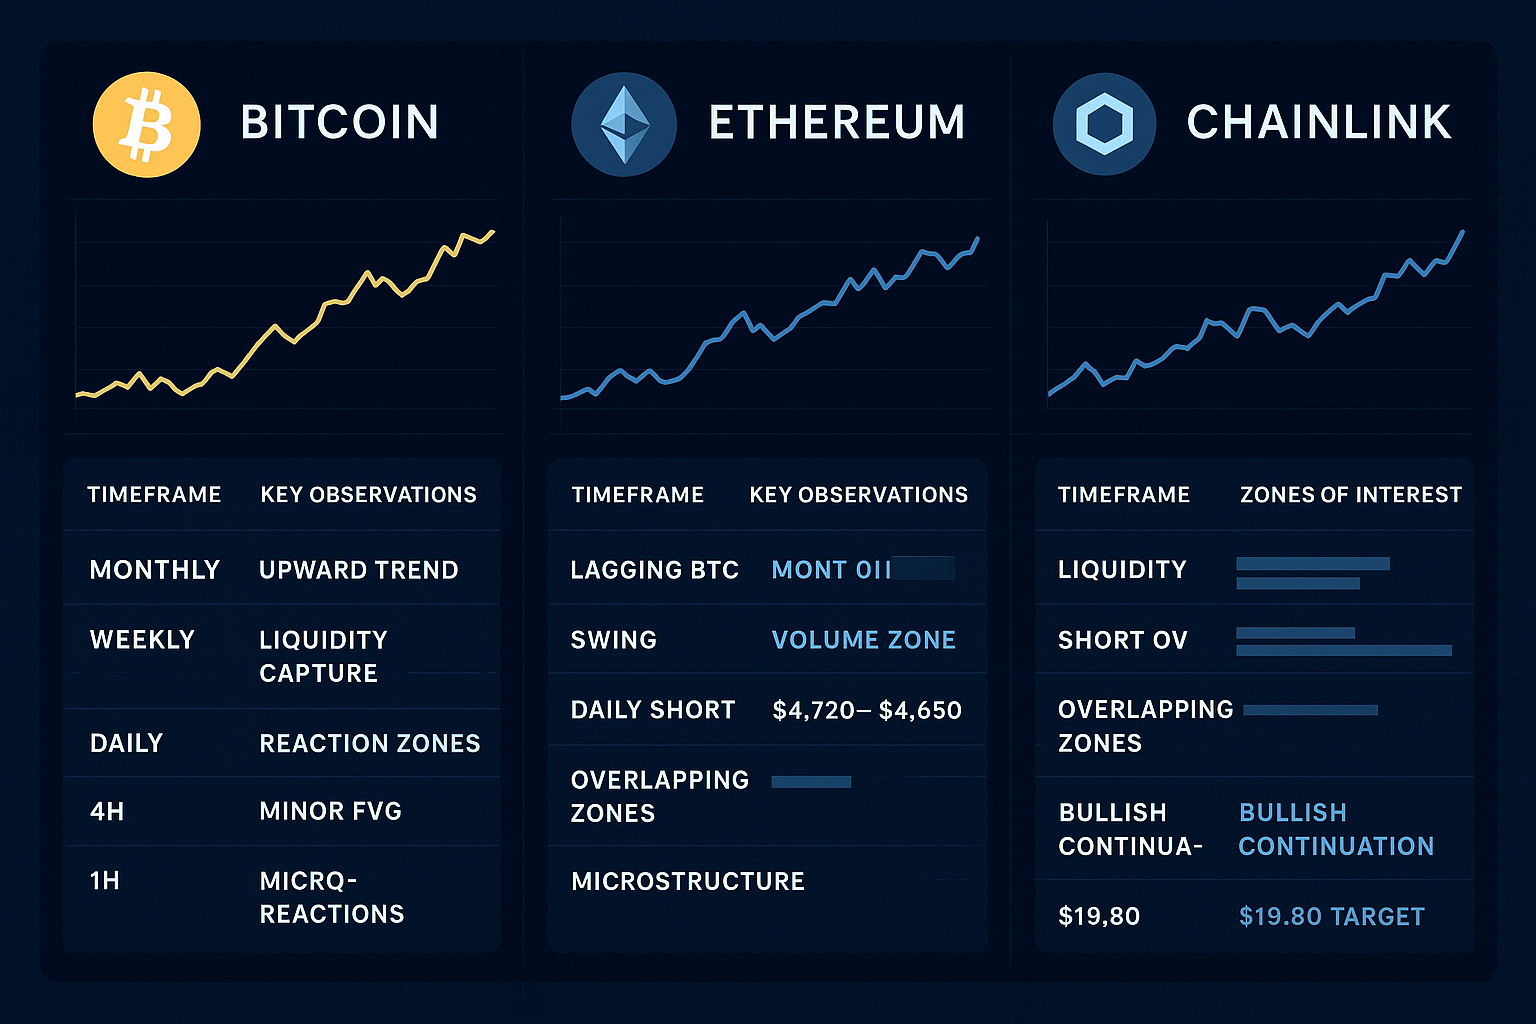
| Timeframe | Key Observations | Zones of Interest |
|---|---|---|
| Monthly | Maintains an upward trend; ATH updated | Watch for corrective movement |
| Weekly | First liquidity capture around prior impulse | $115,345 (volume zone), $108,570–$110,721 (liquidity capture) |
| Daily | Formed daily OVs and reaction zones after ATH | $118,226–$114,800 (FVG), short opportunities |
| 4H | Minor FVG overlaps with daily OVs | Short positions can be considered |
| 1H | Micro-reactions to 4H and daily zones | Await pattern formation for entries |
Summary: Analysts suggest observing liquidity zones and waiting for reactions on lower timeframes to identify short or long opportunities.
Ξ Ethereum Price Outlook
Ethereum has lagged behind Bitcoin’s rally but may approach its own ATH if momentum continues. Weekly and daily zones provide guidance for potential long entries.
| Timeframe | Key Observations | Zones of Interest |
|---|---|---|
| Monthly | Lagging BTC, potential ATH formation | Monitor monthly trend |
| Weekly | Liquidity captured in swing; current volume zone | Key for bullish impulses |
| Daily | Daily short OV formed; potential long FVG | $4,720–$4,650 (FVG for long) |
| 4H | Overlapping zones with daily charts | Observe reactions for entries |
| 1H | Microstructure confirms lower timeframes | Prepare for tactical entries |
Summary: Ethereum’s next movements are tied to liquidity and reaction zones; analysts recommend waiting for confirmation before entering positions.
🔗 Chainlink Technical Analysis
Chainlink shows liquidity formation below key interest zones, providing potential short and long opportunities.
| Timeframe | Key Observations | Zones of Interest |
|---|---|---|
| Weekly | Liquidity built below interest zone | Watch for bullish continuation |
| Daily | Short OV identified; reaction expected | $19.80 target, then assess further short/long setups |
| 4H | Overlapping zones with daily charts | Key for timing entries |
Summary: Chainlink’s weekly and daily charts indicate reaction zones suitable for tactical trading based on liquidity capture.
- BTC: Watch for corrections near $115K and potential liquidity zones around $108K–$110K.
- ETH: Monitor reaction at daily FVG ($4,650–$4,720); momentum may drive toward ATH.
- LINK: Short OV near $19.80, with subsequent opportunities for long positions.
Analysts emphasize observing reaction zones, overlapping timeframes, and liquidity captures before entering positions.


