


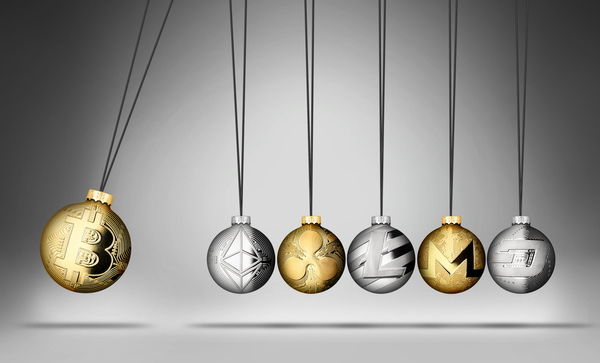
The cryptocurrency market follows cyclical patterns, with capital flowing sequentially from Bitcoin to Ethereum, and then to altcoins. These cycles give rise to the much-discussed “altseason”, a period when alternative cryptocurrencies outperform Bitcoin and generate rapid gains.
📊 Altcoin Market Phases:
| Phase | Focus | Characteristics |
|---|---|---|
| Bitcoin Phase | BTC | High-cap, low-volatility growth, market attention concentrated on Bitcoin |
| Ethereum Phase | ETH | Capital shifts to Ethereum; increasing interest in its ecosystem |
| Large-Cap Altcoins | BNB, SOL, ADA | High liquidity, institutional interest; notable price rallies |
| Mid/Small-Cap Altcoins | Low-cap tokens, experimental projects | High volatility, potential x100 gains, peak media attention |
Altseason is often associated with the fourth phase, when mid and small-cap altcoins surge past Bitcoin and Ethereum in terms of growth rate.
Key Indicators Signaling Altseason
- Altcoin Season Index (ASI)
- Tracks how many of the top 50 altcoins (excluding stablecoins) outperform Bitcoin over the past 90 days.
- Threshold: >75% of altcoins outperforming BTC = altseason.
- September 2025 Status: ASI at 80/100, indicating broad altcoin strength.
- Bitcoin Dominance
- Represents BTC’s share of total crypto market cap.
- Declining dominance suggests liquidity moving into altcoins.
- September 2025: BTC dominance fell to 54%.
- Altcoin Trading Volumes
- Rising volumes confirm real market interest beyond media hype.
- Market Sentiment & Social Activity
- Increased searches, social discussions, and low Fear & Greed Index values indicate higher retail engagement.
- Altcoin Market Capitalization
- Total altcoin cap (excluding BTC and stablecoins) surpassing $1.8 trillion signals a potential altseason.
Visualizing the Trends
Figure 1: Altcoin Season Index vs Bitcoin Dominance (Sep 2024 – Sep 2025)
ASI (Altcoin Season Index)
100 ┤                 ╭─╮
 80 ┤              ╭─╯ │
 60 ┤           ╭─╯    │
 40 ┤        ╭─╯       │
 20 ┤     ╭─╯          │
  0 ┤─────╯────────────┤
       Sep 24 ... Sep 25
BTC Dominance (%)
Figure 2: Altcoin Market Cap vs Bitcoin Dominance
| Month | BTC Dominance | Altcoin Cap ($T) |
|---|---|---|
| Jan 2025 | 63% | 1.5 |
| Mar 2025 | 61% | 1.6 |
| Sep 2025 | 54% | 1.8 |
Charts indicate a consistent decline in BTC dominance alongside rising altcoin capitalization—a classic sign of altseason formation.
Forecast for 2025 Altseason
- Monetary Policy Influence: Potential interest rate cuts by the Federal Reserve could increase market liquidity, fueling interest in risk assets, including altcoins.
- Institutional Involvement: Larger projects, staking platforms, and DeFi protocols contribute to more sustained growth.
- Market Sentiment: Retail engagement and media attention are rising, supporting momentum in smaller-cap altcoins.
📈 Traders and analysts are watching a combination of ASI, BTC dominance, altcoin volume, and sentiment metrics to confirm the strength and sustainability of the upcoming altseason.


